
Blog
Canarys Copy Project
![]()
What is DevOpSmartBoard: DevOpSmartBoard (DSB) is the Ultimate End-To-End and One Stop Dashboard solution for all the Azure DevOps reporting needs at organization and project level.

DevOps words means many things to many people and all the definitions might be partly right. DevOps is all about continuously seeking feedback, understanding challenges, and improving the way the software is development, deployed and consumed by end-user.

DevOpsSmartBoard which helps to generate key metrics at the Azure DevOps organization level and also at the team project level giving users the freedom to access various types of reports based on different needs either role based or SDLC stage. All the reports are available in a single platform and are easy to access at one click.
This view provides metrics about the Azure DevOps Organization. The tiles display total number of users, count of projects, work items, repos, Pull-Requests, Build & Release Pipeline etc. The charts display Bug trend, project wise count of work items, PR, build and release pipelines.
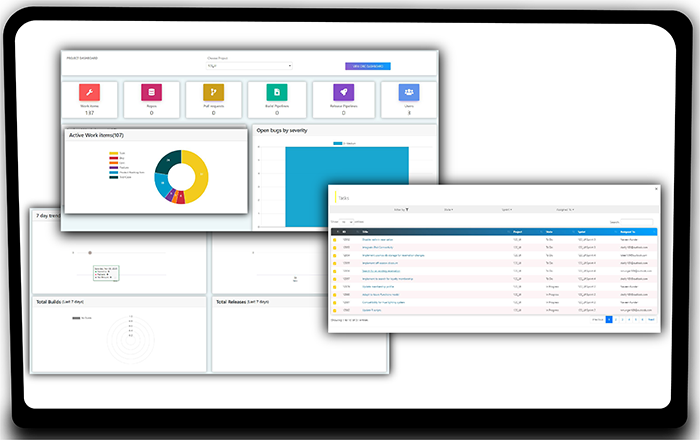
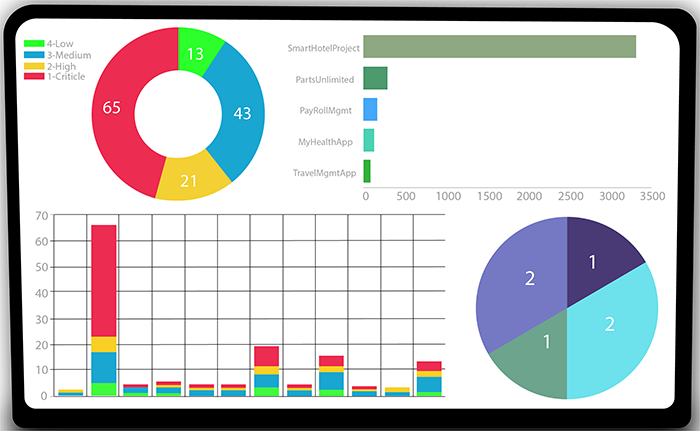
Important metrics of the Team Project like count of work items, repos, pipelines trend etc are provided in this report page. the Tiles display total count of work items, Azure Repos, Pull-Requests, Build & Release Pipeline, and total number of users in the project. The charts display active Work items by type, open bugs by severity, trend of Build and Release executions and outcome

This report provides work item query option across projects with many choices to filter the data
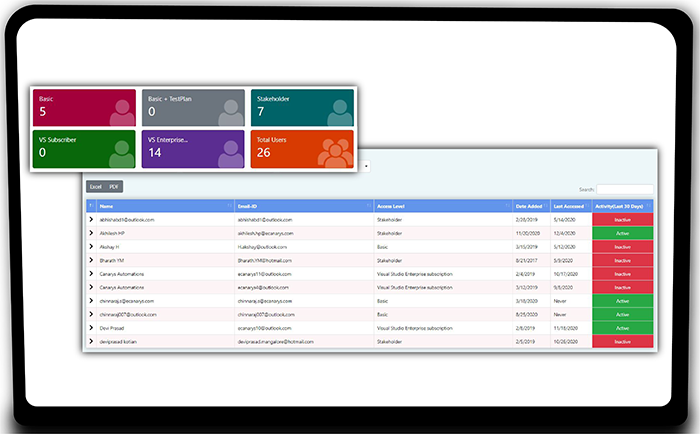
This report basically provides the user details of the DevOps organization, list of users and access to the projects in the organization and based on the activity for last 30 days. It helps them to study the active/inactive status of user and save on license cost by revoking the license for non-active members
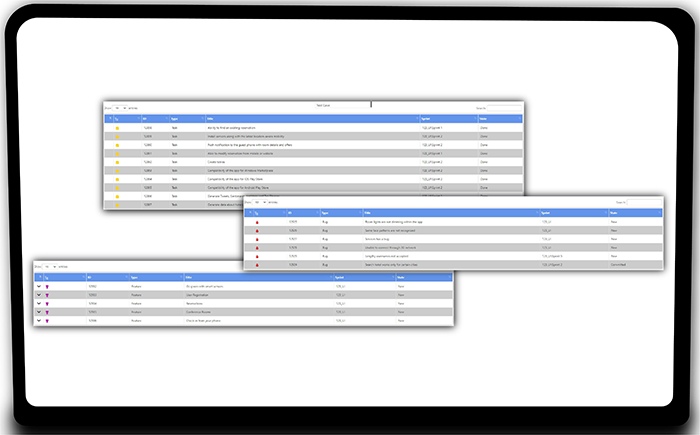
Provides traceability from Epic to Features and from PBI to Task, Test Cases and Bugs. This report helps project managers and leads, to look for end to end traceability right from top level work item type to the lowest level of work item, along with other related items, commits etc.

DevOps and digital transformations have brought an extraordinary increase in the pace and volume of daily change in both development and IT operations. For both IT and development team managing the capacity of multiple teams is difficult and specially when resources are working on multiple teams or playing different roles.

Provides key indicators about the project progress, health like critical bugs trend, build & release failure trends etc.

DevOps practices decreases the risk in deploying software changes to production environments. Post deployment to production, there is a risk that the change will break and lead to expensive issues.
Deployment in DevOps world is key word. The speed and frequency of deployment matters a lot. The more frequent deployments to consumer translates’ to the enhanced feedback cycle.
Insights into the deployment of apps at different environments. This report provides the details of build and release pipeline results across projects that is at the Azure DevOps Organization level, over a certain duration. You can filter based on projects, definitions, stages, results etc.
Canarys Copy Project is a tool developed by Canarys Automations Private Limited, a leading DevOps Solutions company providing innovative software solutions and services. This tool is designed to help teams migrate or copy their Azure DevOps project data across or within the organizations with ease.